The ambiguity function of a radar waveform is the standard
measure of the radar's range and Doppler detection capabilities while
using that waveform for its sensing applications. A new generation of radar systems, called cognitive radar,
is being developed that will be capable of adjusting its design in real
time for changing detection requirements, hopping in operating
frequencies, and meeting fluctuating spectral requirements [1]–[2].
Because the ambiguity function is used to measure the radar's
range/Doppler detection capabilities, the accurate and quick calculation
of the ambiguity function output by the transmitter is of high interest
in the real-time, cognitive optimization of the input waveform to the
transmitter. Amplifier distortion due to nonlinearity is capable of
altering the ambiguity function of the waveform input to the
transmitter, so a measurement at the transmitter's output is a way to
ascertain the actual detection capabilities of the radar. This problem is explored extensively by Jakabosky et al. who demonstrate that radar transmitter amplifier distortion results in increased range sidelobes [3]. This is commonly known as an “amplifier-in-the-loop” problem. Jakabosky et al.
also demonstrate a setup that measures the zero-Doppler range portion
the ambiguity function and further uses this capability to optimize a
nonlinear frequency-modulation (FM) chirp [3]. Our
present paper demonstrates calculation of the entire ambiguity function
from the measured output waveform from a radar amplifier to be
calculated in real-time, enabling the cognitive radar to reconfigure its
waveform to meet detection requirements and spectral constraints. We
also examine briefly the results to note some effects of amplifier
distortion.
In addition to being able to adjust the range/Doppler detection
capability of the radar in real-time, development of cognitive radar is
motivated by a need for radar systems to meet tighter spectrum
constraints and to facilitate flexibility in operating frequency. The
United States National Broadband Plan has required 500 MHz of
currently occupied spectrum to be released for wireless broadband
applications by 2020. Radar systems are currently assigned much of the
bandwidth that is expected to be reassigned under this plan. The
continued growth of demand for communications systems that operate under
the dynamic spectrum access protocol also seem to indicate that
future radars may need to be frequency flexible and that operating bands
(and also spectral requirements) must change in real-time. Our work on
ambiguity function optimization is part of an effort to create an
adaptive radar whose circuitry and waveform are simultaneously
optimizable in real-time to meet the criteria of (1)
detection (based on ambiguity function), (2) transmitter amplifier
power efficiency, and (3) spectral mask compliance. The accurate
measurement of the transmitter's output waveform is a critical piece of
creating this optimization, and it is this part of the research that we
detail in this paper.
We are performing the ambiguity function measurements as part of a
real-time waveform optimization based on obtaining a desired ambiguity
function while meeting spectral mask constraints. The optimization uses a minimax approach described in a previous paper [4].
The literature shows evidence of working toward a realtime waveform
optimization to maximize detection and meet spectral constraints.
In the area of waveform optimization, the design of spectrally confined
waveforms through variable-modulus techniques is described in [5], and then through constant-modulus techniques such as continuous-phase modulation in [6]–[7] and piecewise linear chirp optimization in [8].
Skolnik discusses the connection of the ambiguity function with the
waveform, including properties of frequency-modulated bursts, or chirps [9].
Patton demonstrates optimization of the linear frequency-modulated
(LFM) chirp design by tuning the nonlinear Fourier Series perturbations
to the phase in [10]. Holtzman and Thorp use the ambiguity surface as a weighted error criterion for waveform optimization in [11]. [12]
by Wong and Chung examines use of genetic algorithms to minimize the
ambiguity function volume in different regions of the range-Doppler
plane. In [13], Sussman applies least-squares optimization to the radar waveform problem. Blunt et al. and Cook demonstrate the use of continuous-phase modulation to minimize the spectral spreading of waveforms [6]–[7]. Finally, [4] and [14]
represent our state of the art in optimizing radar systems. Measuring
the ambiguity function of the amplifier's output in order to optimize
the transmitted waveform is what motivates the work presented in this
paper.
SECTION III
CALCULATING AN AMBIGUITY FUNCTION FROM MEASUREMENT DATA
As mentioned in the Introduction, the ambiguity function can be a
useful tool for selecting the best waveform to use in a radar system.
Our approach is to measure the waveform in the time domain with a 5 GHz
oscilloscope, and then convert the waveform to baseband. In our approach, the waveform is down-converted to baseband to perform the real-time optimization, as in [4].
The downconversion is necessary for speedy analysis and optimization
due to the number of samples required to measure the full output signal
from the amplifier at our carrier frequency of 3.3 GHz. Sampling at
exactly the Nyquist rate, a 10 microsecond chirp at a carrier frequency
of 3.3 GHz requires over 66,000 samples to represent. The resulting
ambiguity function from those samples is a square matrix 66,000 by
66,000, so a minimum of 4.4 billion matrix elements would need to be
calculated in that ambiguity function, far more than can be reasonably
calculated in a real-time optimization. It is desirable to calculate the
ambiguity function for the output waveform from the amplifier, however,
because the amplifier's distortion will have an impact on the resulting
ambiguity function.
In calculating the ambiguity function for measured data, we
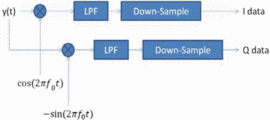
down-convert and down-sample the measured data. The technique required
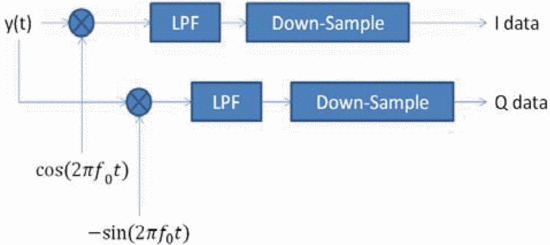
to do that is a fairly well known technique, which works as shown in Fig. 2. In the down-conversion process, the signal is separated into its in-phase  $(I)$ and quadrature
  $(Q)$ components. The signal
  $y(t)$ in Fig. 2
represents the signal measured at the output of the amplifier. That
signal is then mixed with a sine and a cosine at the carrier frequency
  $f_{0}$.
That signal is then passed through a low-pass filter to remove the
high-frequency duplicates from the mixers. To maintain the same number
of samples per cycle of the highest frequency component, the signal is
down-sampled by the ratio of the carrier frequency to the bandwidth of
the baseband chirp being used. For the measurements shown at the end of
this paper, that ratio is 3.3 GHz to 10 MHz, which means that only one
of every 330 samples is required to represent the chirp signal at
baseband. The
  $I$ and
  $Q$
data represent the in-phase and quadrature components of the baseband
signal and can finally be recombined in order to calculate a much
smaller ambiguity function.
We used measurements in our nonlinear test bench to measure the ambiguity function of chirp waveforms [15].
The measurement setup consists of the following: an Agilent N5182A
signal generator, a Skyworks SKY65017 InGaP amplifier as the device
under test, an Agilent E3647A DC power supply, a Maury Microwave
Automated Tuner System (ATS) load-pull setup, an Agilent N1911A power
meter, an Agilent E4407B spectrum analyzer, and a LeCroy Wavemaster 8500
oscilloscope. The signal generator is used to
convert the programmed chirps to the carrier frequency of 3.3 GHz used
in these experiments, and the Maury load-pull system is a key component
of the circuit portion of the optimization that is described in [14].
The DC power supply provides a 9 V bias to the Skyworks amplifier. The
oscilloscope is used for the actual measurements of the time domain
chirp signal.
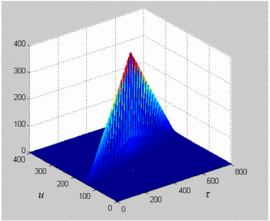
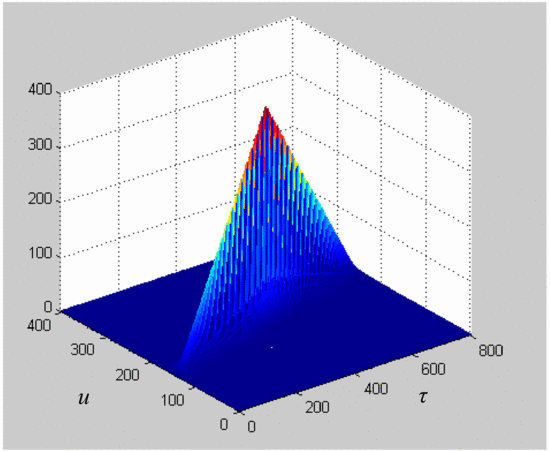
Fig. 3 shows the magnitude plot for a measured
ambiguity function using the measurement system described in the
previous paragraph without the amplifier in the loop. This provides a
reference to confirm that the process described in the previous
paragraph will provide accurate results for the ambiguity function. This
final check allows confident analysis of the effects of the amplifier's
distortion on the ambiguity function. While the axes in Fig. 3 are labeled as delay  $\tau$ and Doppler shift
  $u$,
they are given in points rather than in Hz or seconds. These points
represent the entries involved in the ambiguity function matrix
calculation, and can be converted to seconds (for delay) and Hertz (for
Doppler frequency. The measured chirp used to calculate this ambiguity
function is a down-chirp with 5 MHz bandwidth.
In analyzing the effects of the amplifier's distortion on the
ambiguity function is to convert the ambiguity function to a logarithmic
scale instead of the linear scale shown in the previous figures.
Converting to a logarithmic scale allows for easier comparison of the
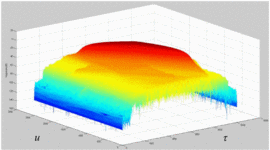
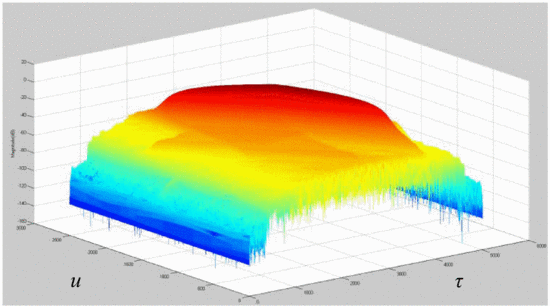
distorting effects on the various chirps. Fig. 4
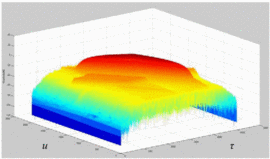
shows the default view of a logarithmic magnitude (dB) plot of an
ambiguity function for an up chirp with 10 MHz bandwidth without the
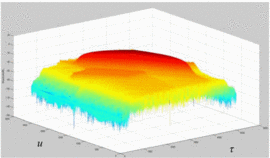
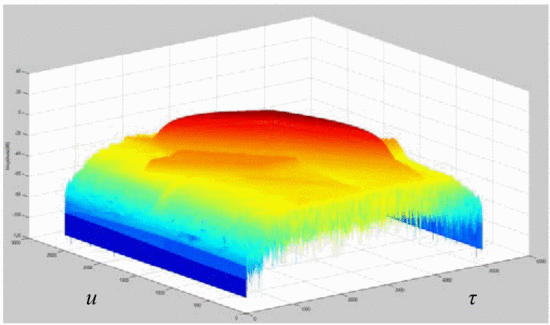
amplifier in the measurement. Fig. 5 shows the
result for the same chirp, only with the amplifier in the measurement,
with the amplifier terminated in the load impedance providing maximum
power-added efficiency (PAE), as determined by a separate load-pull
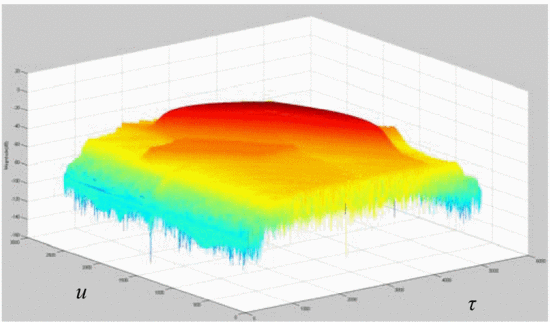
measurement. Fig. 6 shows the result for the same
chirp and amplifier, but for this test the amplifier is terminated in
the load impedance providing the minimum adjacent-channel power ratio.
These figures still do not make the distorting effects obvious, however,
so the figures are then rotated to look along the edge of the primary
peak of the ambiguity function.
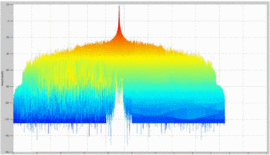
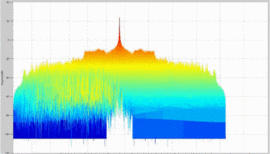
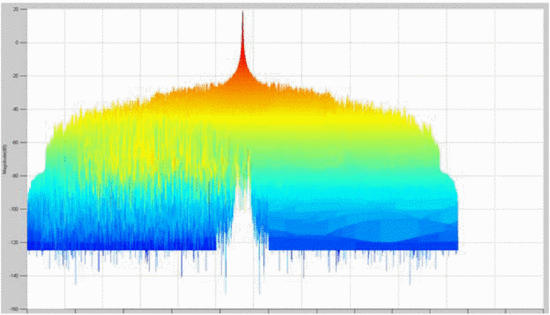
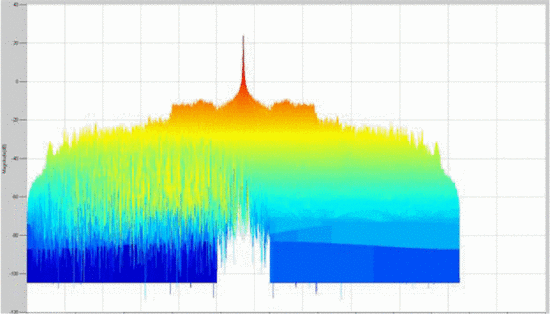
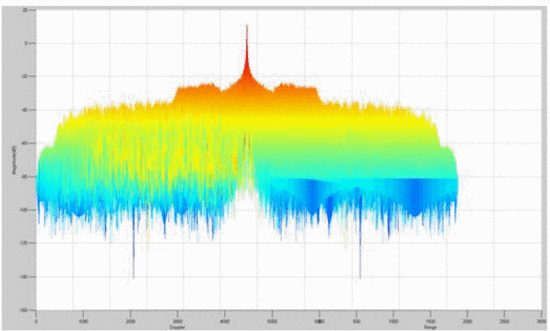
It is insightful to examine rotated plots of the ambiguity function; that is, to view the main ambiguity ridge “head-on.” Fig. 7 shows the head-on view of the ambiguity function of the waveform measured without the amplifier in the loop. Fig. 8
shows the rotated plot of the ambiguity function of the amplifier's
output waveform, where the amplifier is terminated in the maximum-PAE
load impedance, and Fig. 9 shows the rotated plots
of the ambiguity function of the amplifier's output waveform when
terminated in the minimum-ACPR load impedance.
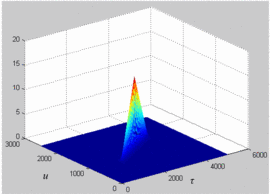
Several effects can be notice through examination of the head-on view of these measurements. Unlike Fig. 7, which examines the amplifier's input waveform, Fig. 8 reveals that a “spreading” of the ambiguity occurs as a result of the amplifier's nonlinearity. In Fig. 7,
the difference between the peak of the main ambiguity ridge and the
maximum ambiguity in the adjacent side-region is approximately 45 dB.
However, in Fig. 8, with the amplifier in place,
this difference is reduced to approximately 34 dB. This effect of
distortion is significant: the interpretation of these results is that
the distortion of the amplifier impacts the range/Doppler precision of
detection in some regions parallel to the main ambiguity ridge. Fig. 9
shows that when the amplifier is terminated in the load impedance
resulting in minimum ACPR, the signal energy decreases due to decreased
efficiency, and thus the height of the main ridge decreases. Further
studies will examine the significance of the “ambiguity spreading” and
make a theoretical connection to amplifier nonlinearities.
This work has been funded in part by the National Science Foundation
(Award No. ECCS-1343316) and the United States Naval Research
Laboratory. The authors wish to thank David Moon, formerly of Baylor
University, for his work and insight on ambiguity functions that has
benefitted the analysis presented in this paper.


